
RETECHNOLOGY PREMIUM MARKETPLACE RELATED PRODUCTS | WEBINARS | SPECIAL OFFERS


You are viewing our site as an Agent, Switch Your View:
Agent | Broker Reset Filters to Default Back to ListHow to Use RPR and Canva to Make Shareable Market Charts for Social Media
June 28 2020
 There's much more to RPR than working with buyers, nailing listing presentations, and creating an investment analysis. In fact, REALTORS who want to up their game when it comes to social media marketing can quickly adapt RPR data and charts into a campaign that will draw attention from your network. There's a lot of eyeballs in social media, and it's easier than ever to grab them!
It all starts with using RPR to share market trends about your marketplace on Facebook or Instagram. Here, we offer a few examples showing how RPR reports can be leveraged to create a social media campaign that will attract prospects. Below are examples of using RPR reports and Canva to create attention-getting, data-packed graphic posts. At the end of this article, you'll know how to do this yourself!
In this example, we'll be using a few resources:
RPR Market Activity Report
The Market Activity Report is a snapshot of all the changes in a local real estate market. It includes a market activity summary and a listing of active, pending, sold, expired and distressed properties. Recent price changes and upcoming open houses are also included.
A screenshot application
For this exercise, you'll need to be able to create a screenshot from your computer. It's likely your computer has this feature already built-in. For directions:
- For Windows 10
- For Mac
- Snag it (Paid option)
Canva.com
Canva is a web-based tool designed to help you build graphics for social media, presentations, brochures and more. They also provide thousands of preset layouts that can be adapted, or you can start your design from scratch. They offer a free plan that will get you started.
Begin by Creating a Marketing Activity Report
Let's start by creating a Market Activity Report in RPR:
- Visit RPR at narrpr.com.
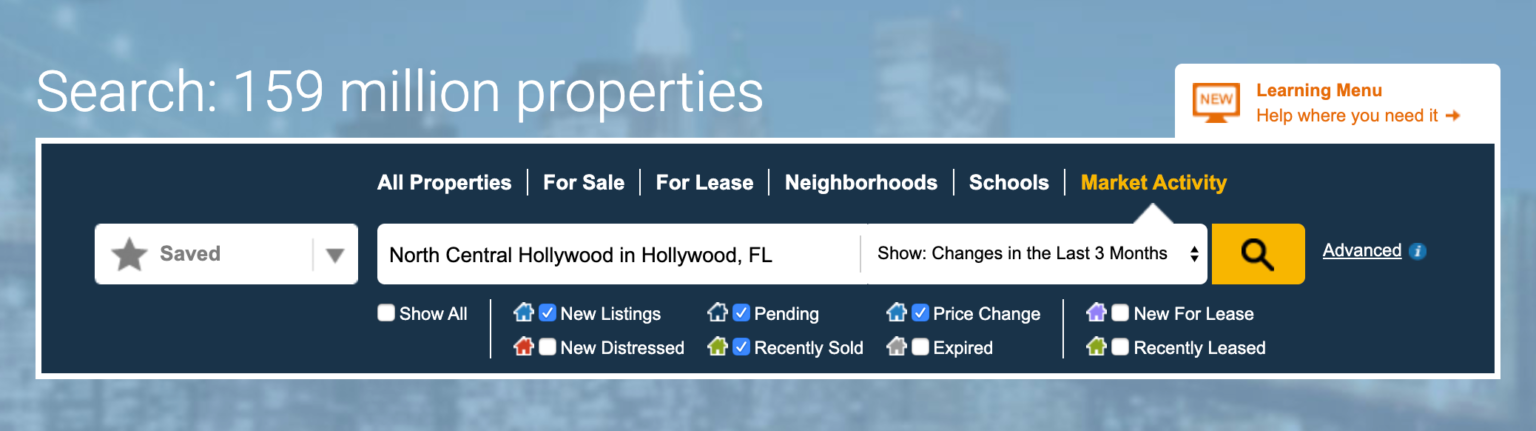
- On the homepage, select the Market Activity search type.
- Enter your market area. This can be anything from a neighborhood, zip code, city, and beyond. For this example, I'll use a neighborhood in Hollywood, Florida: North Central Hollywood.
- Choose how far back to go for the results.
- Also choose which property statuses to include.
NOTE: If needed, additional search criteria can be accessed from the advanced search. Select the magnifying glass to search.
- From the search results, the filters here on the left can be used to narrow the results further or we can go directly to creating our Market Activity report.
- Now choose Create a Report to continue on to the reports generation page
- Select Market Activity Report
- Click on More Details to make any customizations
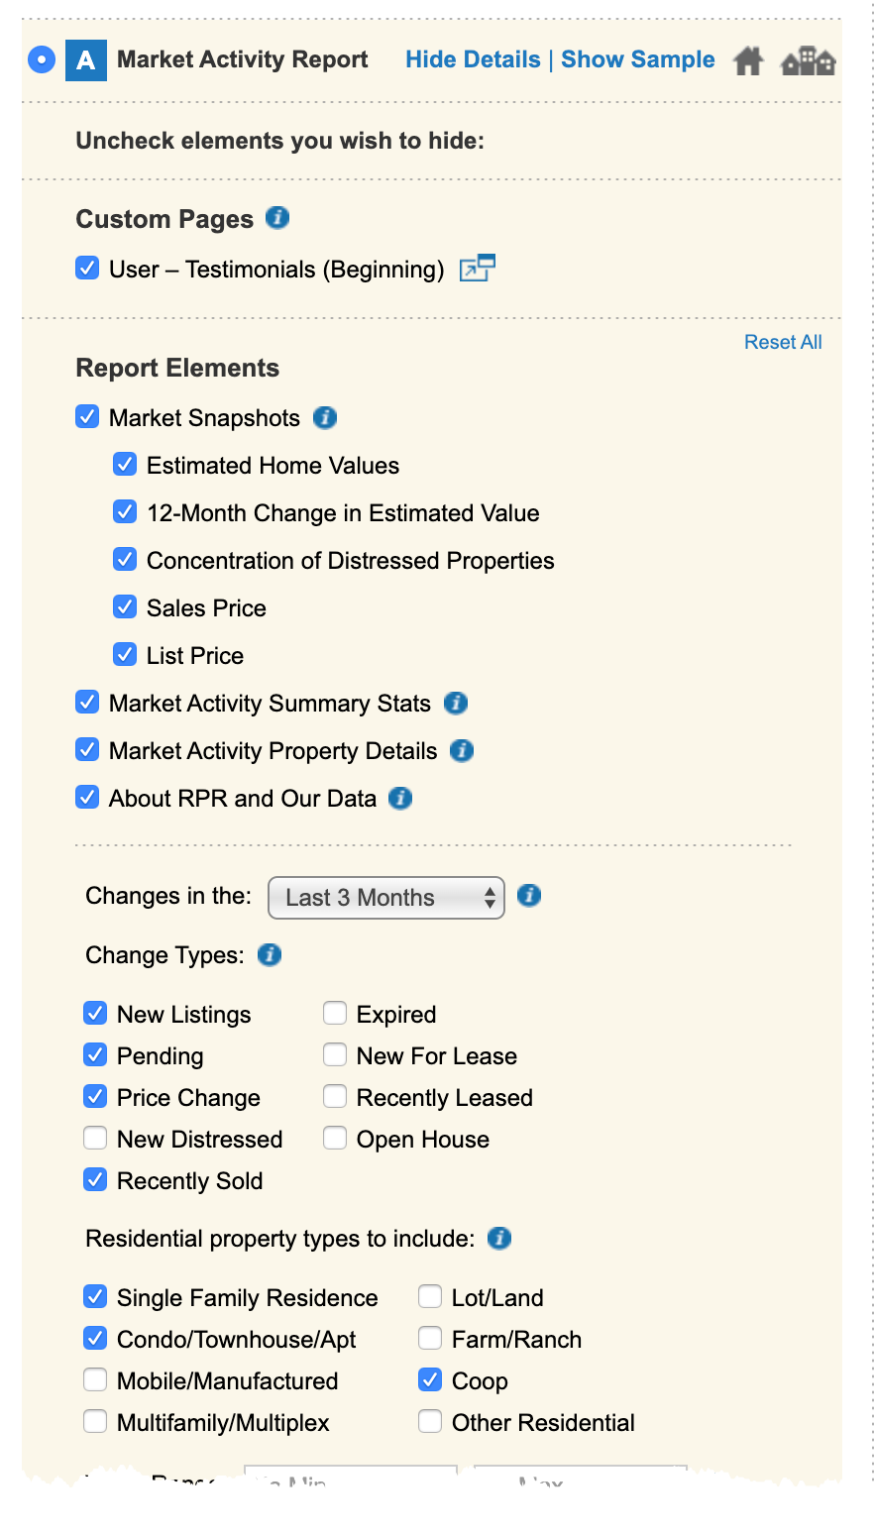
- Now select Download as our delivery format
- Select Run Report
Pro tip: If you want your market activity report to represent a custom area, that's totally possible using the RPR map. Click this previous RPR blog: "Create a Market Activity report for any neighborhood" for step-by-step instructions.
Now for the Screenshot
In this example, let's assume the role of a listing agent who is looking to create a shareable graphic that can be added to Facebook and Instagram—one that will hopefully pique the interest of their network. However, you're not limited to this example. Think about your real estate brand, your business niche or your unique selling proposition, and align the graphic and messaging to match.
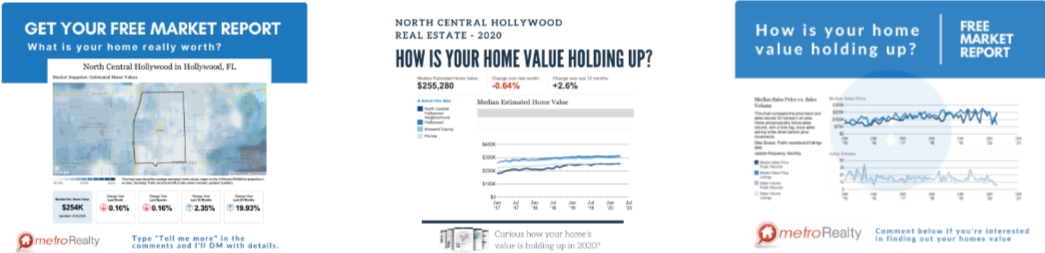
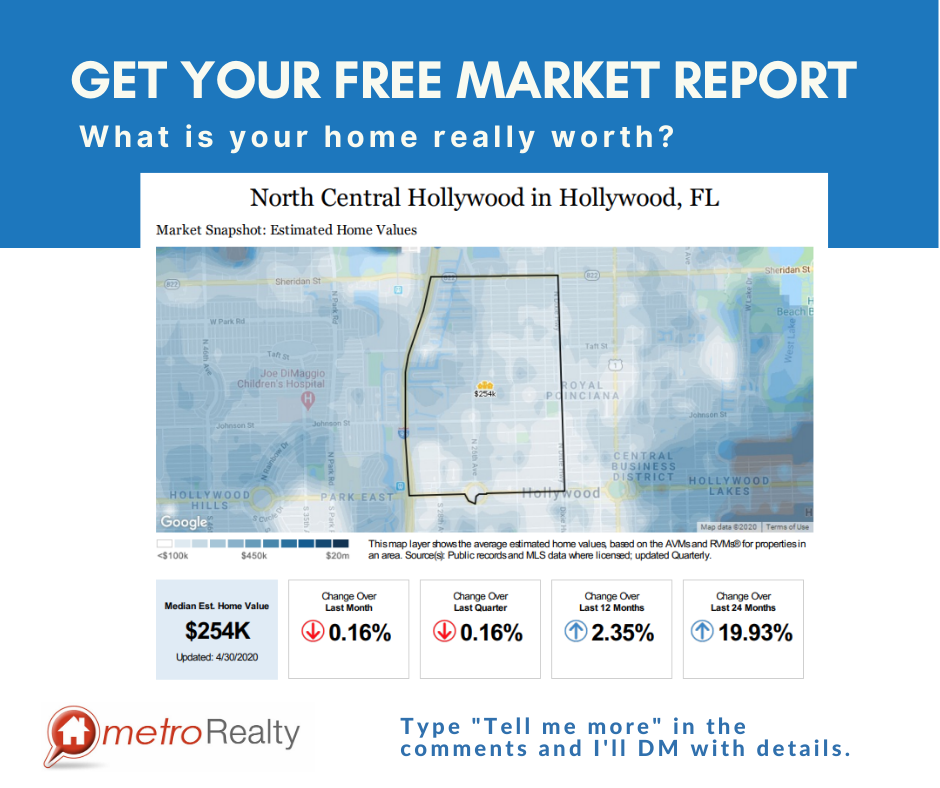
To grab the screenshot, go to page #2 of the Market Activity Report where RPR includes a heat map showing the estimated values for the reported area. Also available are estimated changes over last month, the last quarter, the last 12 months, and the last 24 months.
This visual will go nicely with a call to action that reads, "How is your home value holding up in 2020?"
As prospects see your message on social, they can comment to get involved. Once they do, it's a simple ask of their address, and just like that, you have a new contact. Then you visit RPR, create a mini-property report that includes the RVM® value and email it back to the prospect. You could even offer an appointment to provide a deeper pricing analysis.
Okay, so what are we waiting for? Let's go build it.
Putting It All Together: Building the Social Media Image
As mentioned earlier, we're going to be using Canva to make this graphic. If you prefer a different graphics program, by all means use that. We've selected Canva because it's web-based, offers a free plan, and makes sizing and layout of images hassle-free.
Okay, so let's get started...
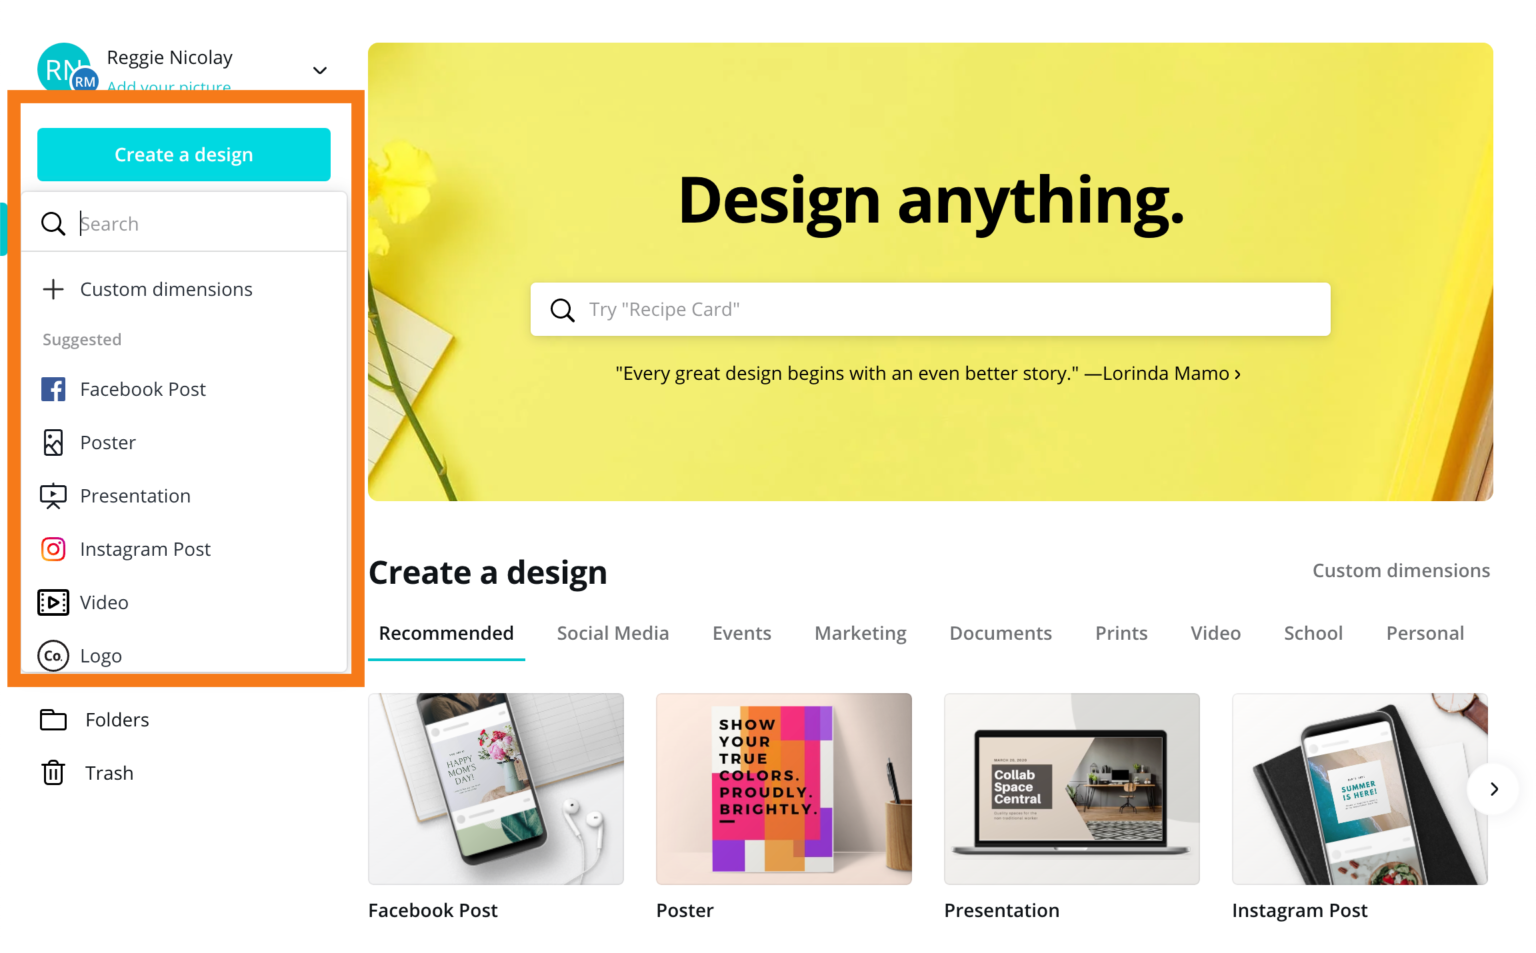
- Visit Canva at canva.com
Note: You'll notice that Canva offers tons of templates that you can use as a starting point. Let's build one from scratch.
- Select Create a Design and browse through the preset choices. You'll see there are lots of options. Or you can choose Custom Dimensions to enter your own size. For this example, let's choose Facebook Post.
Note: After selecting Facebook Post, a blank canvas will appear. To the left, easily add Templates, Photos, Elements, Text, Music, Videos, Backgrounds and uploads.
- Start by selecting Elements and then dragging the square shape to the canvas. Then, adjust to cover the top third. For this example, I'll change the background color to blue.
- Next, select Text and scroll through the preset formats. Look for one that's close to what you want.
- Now drag the text layout to your canvas. If you want to separate the text blocks, right mouse click, and choose Ungroup.
- Using your mouse, select the text and begin typing your headline. Try: Get Your Free Market Report
- Now adjust the font color and size as needed.
- Now repeat for the subheader. What is your home really worth?
- Keep Canva open, but switch screens to now view the RPR Market Activity report. With the chart displaying, grab a screenshot of it.
- Switch back to Canva and now paste the screenshot image. The chart should show up. If you made an image of the chart instead, you can add it using the Uploads link on the left.
- Now add a logo and resize if necessary.
- We can also add some extra text to show prospects how to participate. Get your report by typing "Tell me more" in the comments below
As you can see, these graphics come together pretty quickly. If you like what you've done and want to duplicate it to make subtle changes, there is a copy page button.
When finished, select the down arrow to download your graphic file. Now upload to your destination of choice.
Ready to share on Facebook or Instagram
Congrats! You've now created your own social media-friendly market chart. You can also experiment with different market charts and datasets.
Try sharing them to your social media channels, such as Facebook or Instagram. It's a great way to let homeowners and potential home buyers in your market know that you are a local real estate expert. Right now, people have lots of questions about the market and their home values. Posting these charts positions you as the go-to source for up-to-date information. Good luck!
To view the original article, visit the RPR blog.